Identifying Thyroid & Cancer Risk Patterns Through Healthcare Data Analysis
Project Details
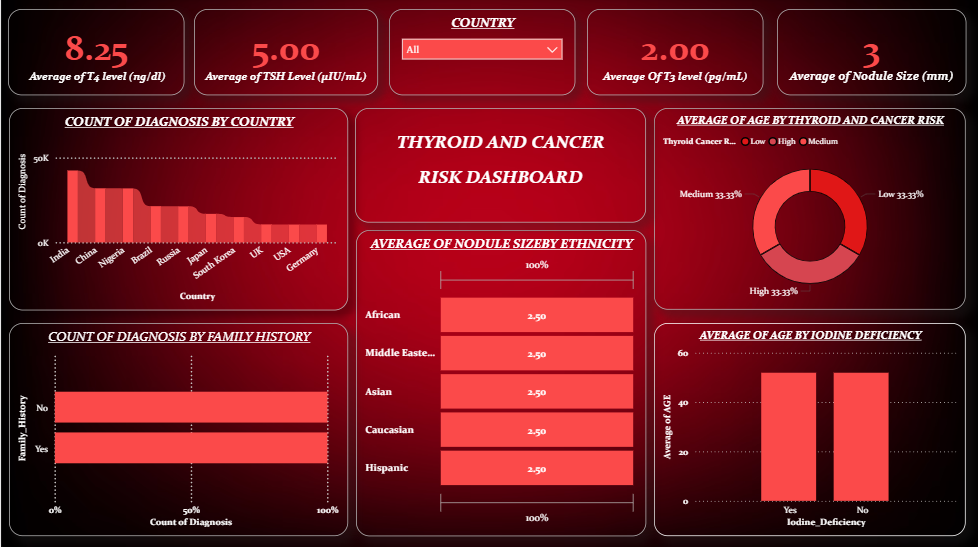
This Power BI dashboard transforms clinical data into a diagnostic tool for identifying thyroid cancer risk factors. It monitors critical biomarkers—T3, T4, and TSH levels—alongside physical indicators like nodule size to provide a 360-degree patient view. By correlating risks with ethnicity, family history, and geography, the project uncovers demographic patterns that raw data obscures. Key features include dynamic country-level filtering and comparative age-based risk modeling. This solution solves "data silos" by unifying medical variables into one interface, enabling stakeholders to make faster, evidence-based health interventions.
Skills
Tools
PROJECT DESCRIPTION :
I specialize in high-stakes Data Visualization, as demonstrated by my work in healthcare analytics—specifically my Thyroid and Cancer Risk Dashboard. I don't just 'make charts'; I build diagnostic tools that reveal critical patterns across demographics and clinical markers.
What makes my service special:
- Complex Correlation Mapping: In my Power BI projects, I connect diverse variables—such as ethnicity, family history, and hormone levels (T3/T4/TSH)—to provide a multi-dimensional view of risk.
- Clean, High-Impact UI/UX: I use custom themes and layouts (like my 'Dark-Mode Medical' interface) to ensure data is scannable and professional for executive-level review.
- Advanced Filtering: I build responsive slicers (like Country/Region) that allow users to drill down from global trends to specific localized insights instantly.
What you can expect:
- Automated Insights: Reports that calculate averages (like nodule size or age) dynamically based on your filter selection.
- Actionable Storytelling: I transform raw clinical data into visual stories that help stakeholders identify high-risk groups or operational bottlenecks.
The problems I solve:
I eliminate 'Data Blindness' by unifying disconnected metrics into a single, cohesive interface, allowing you to spot trends before they become problems
