Precision Agriculture: 2024 Global Crop Yield & Environmental Analytics
Project Details
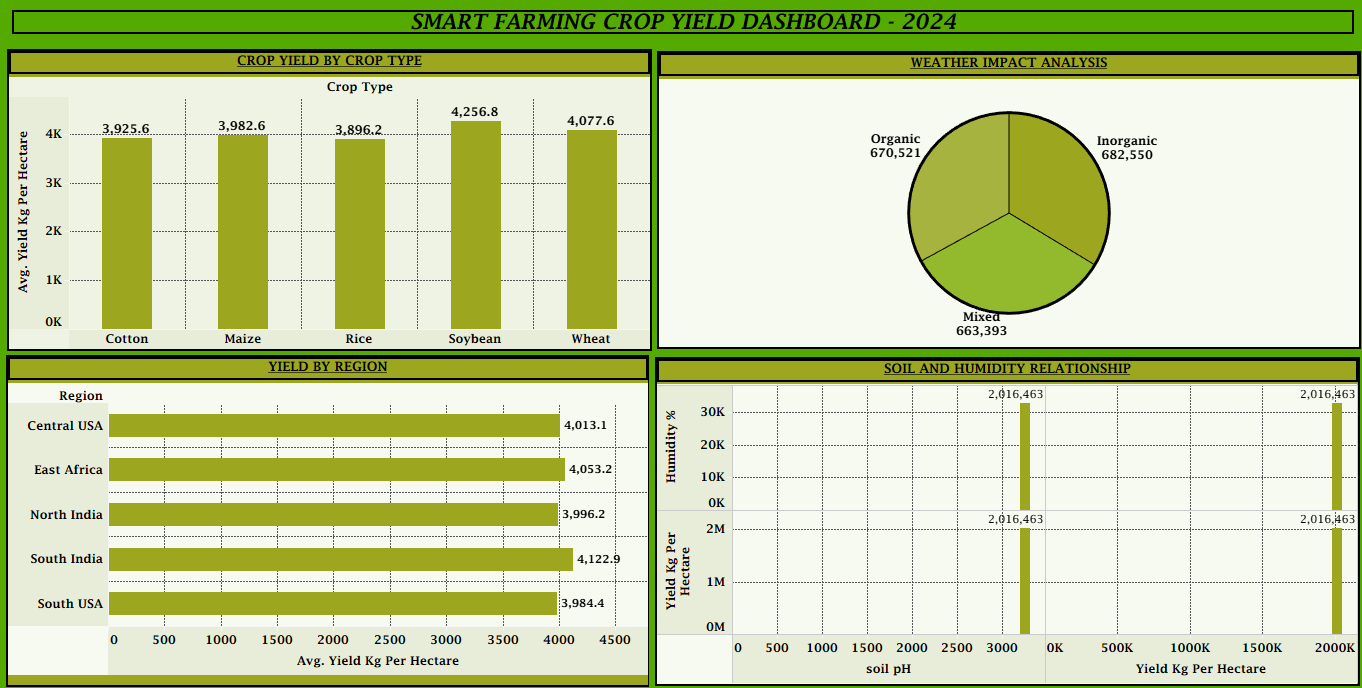
This Tableau dashboard optimizes global crop production by transforming environmental data into strategic insights. I synthesized data across five regions, tracking yield performance for staples like Soybean and Wheat. The tool features advanced correlation modeling between soil pH, humidity, and output, alongside a methodology audit of Organic vs. Inorganic efficiency. By unifying disparate climate variables into a professional, four-quadrant interface, the project eliminates operational guesswork. It empowers stakeholders to maximize resource allocation and regional yields through precise, evidence-based clarity.
Skills
Tools
I specialize in high-impact Business Intelligence, as demonstrated by my Smart Farming Crop Yield Dashboard. I don't just 'visualize data'; I build agricultural diagnostic tools that reveal critical intersections between environmental conditions and commercial output.
What makes my service special:
- Environmental Correlation Mapping: In my Tableau projects, I bridge the gap between technical metrics—such as Soil pH and Humidity %—and operational results (Kg per Hectare) to provide a multi-dimensional view of farm productivity.
- Methodology Benchmarking: I design comparative views that evaluate the efficiency of Organic, Inorganic, and Mixed farming methods, allowing stakeholders to identify the most sustainable and profitable paths forward.
- Geospatial Drill-Downs: I build regional performance trackers that allow users to instantly compare yields across diverse global territories, from Central USA to South India.
What you can expect:
- Dynamic Resource Optimization: Reports that track variable shifts, like how a 4,256.8 Kg/Hectare yield for Soybean compares to other staples under specific climate conditions.
- Executive-Ready UI/UX: I use clean, themed layouts (like my 'Agri-Green' professional interface) to ensure complex environmental data is scannable for rapid decision-making.
The problems I solve:
I eliminate 'Operational Guesswork' by unifying disparate soil, weather, and production metrics into a single source of truth, allowing you to optimize resource allocation before the planting season begins.
